Parsimony and Machine Learning in Neuroimaging
Background
The brain undergoes changes throughout an individual’s life. With aging in adulthood, the cortex thins, gray matter decreases and CSF volume increases, and subcortical structures and overall brain volume decrease. Changes also occur during development before adulthood.
The modulations and development patterns in adult brains provide the framework for identifying clinically applicable deviations. Studies show that structural and functional developments in the brain relate to cognitive development. Thus brain-based age predictions have the potential to identify and capture aberrant changes from natural brain development.
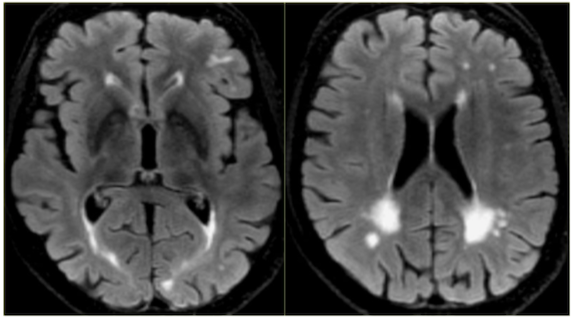
Figure 1. On the right, a brain with severe dementia is depicted. On the left, a healthy brain is depicted.
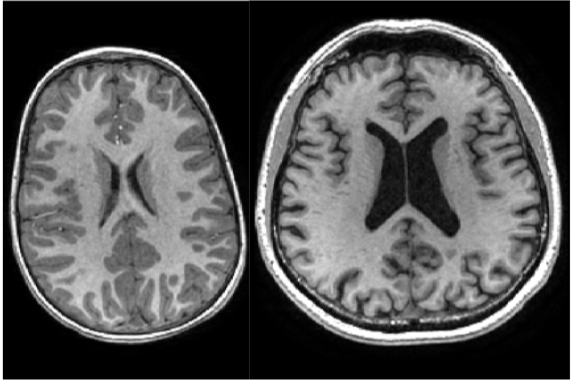
Figure 2. On the right, a senior brain is depicted. On the left, a young brain is depicted
This study seeks to predict chronological age with the application of a more parsimonious version of the structural portion of the machine learning model built in Liem et al. without losing predictive ability. This parsimonious model seeks to improve accuracy and generalizability of previous unimodal models while also being computationally inexpensive for predicting brain age. As with other models, the approach to building a machine learning model seeks to balance the difficulty of the problem with the complexity of the model. Creating a model that is parsimonious and does not overfit, while also incorporating information relevant to the target prediction is crucial for optimal model performance and generalizability. The goal of parsimony is to match used features to the most salient characteristics that show changes with aging.
Data
NNDSP data: This dataset contains MRI and fMRI brain scans of healthy controls scanned. This data represents an independent sample collected from individuals across a broad range of ages (ages 5-77).
HCP data: Data used in the preparation of this work were obtained from the Human Connectome Project. The data were already collected before the commencement of this study. This data represents an independent sample collected from individuals across a small age range (ages 22-37).
NKI data: The Rockland sample contains MRI and fMRI brain scans from the Enhanced Nathan Kline Institute. The NKI data represents an independent sample collected from individuals across a broad age range (ages 6-85). The NKI dataset can be downloaded from the Nathan Kline Institute’s online repository.
Methods
Complex Model
In this study, we took the structural model designed by Liem et al. but trained it on the NNDSP data instead of the LIFE data. The inputs for the complex model were:
- Cortical thickness at 2,562 vertices for each hemisphere (5,124 vertices total)
- Cortical surface area at 2,562 vertices for each hemisphere (5,124 vertices total)
- Subcortical volume for 66 structures
The cortical thickness and cortical surface area measurements were randomly reduced from the original 5,124 vertices to 2,562 measurements from the total freesurfer output. Thus there were a total of 10,314 ([5,124 vertices * 2 measures] + 66 subcortical) input features used to construct four machine learning models:
- A unimodal cortical thickness model trained on cortical thickness features via support vector regression
- A unimodal cortical surface area model trained on cortical surface area features via support vector regression
- A unimodal subcortical volume model trained on subcortical volume via support vector regression
- A complex model that stacks the single modal cortical thickness, cortical surface area and subcortical volume models via random forest. This is the model we refer to as the complex model.
Simple Model
The simple model attempted to achieve the same predictive ability as the complex model with fewer input features. The four features in this model, white matter fraction, gray matter fraction, CSF fraction and total intracranial volume, were chosen in advance based on evidence in the literature that these measurements are correlated with age. The inputs for the simple model were extracted from FreeSurfer (v5.3) aseg file:
- White matter fraction, which was calculated from the sum of cerebral and cerebellar white matter measurements for both hemisphere divided by the total intracranial volume.
- Gray matter fraction, which was calculated from the subcortical gray matter volume measurement divided by the total intracranial volume.
- CSF fraction, which was calculated from the CSF measurement divided by the total intracranial volume.
- Total intracranial volume, which is simply extracted from the FreeSurfer aseg file We built a simple machine learning model with support vector regression on these four features to predict age. This is the model we refer to as the simple model.
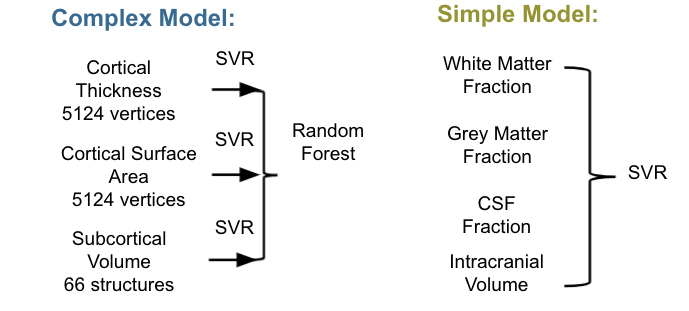
Figure 4. The complex model (blue) is built with single modal cortical thickness, cortical surface area and subcortical volume feature vectors with SVR and then stacked with Random Forest. The simple model (green) is an SVR model on the white matter, grey matter, CSF fraction and intracranial volume measurement inputs. All three models are tested on new data, such as the hold out data, HCP and the NKI data.
We applied the complex and simple model to novel data such as HCP and NKI. The purpose of this step was to test the generalizability of each model by evaluating the performance of each model on unseen data. To conclude the analysis, we performed statistical tests and evaluated the predictive ability of each model on out of sample and novel data. Following the construction of the complex and simple models, we evaluated each of our hypotheses.
Results
This is analysis, we tested the performance of the simple and complex models trained on the NNDSP data against a test (left out) sample from NNDSP. We found that the performance of the simple model (R2 = 0.56, CI = (0.47, 0.64)) was not significantly different from the performance of the complex model (R2 = 0.81, CI = (0.76, 0.85)) on out of sample data.
With a Wilcoxon Signed Rank Test (statistic = 10031.0, p = 0.235, df = 208), we could not conclude a difference between the simple and complex models since the p-value is greater than our multiple comparisons corrected alpha of 0.0166. However, the two sample Kolmogorov-Smirnov test (statistic = 0.181, p = 0.002), which was performed as an exploratory analysis, indicates that there is a difference in the distributions of prediction errors for the simple and complex models. Figure 5A depicts the distribution of errors in predicting age for the simple (red) and complex (blue) models. Figure 6 depicts the chronological age as it correlates with prediction errors. The absolute error increases for both the simple and complex model with age, suggesting that predictive performance for older individuals declines.
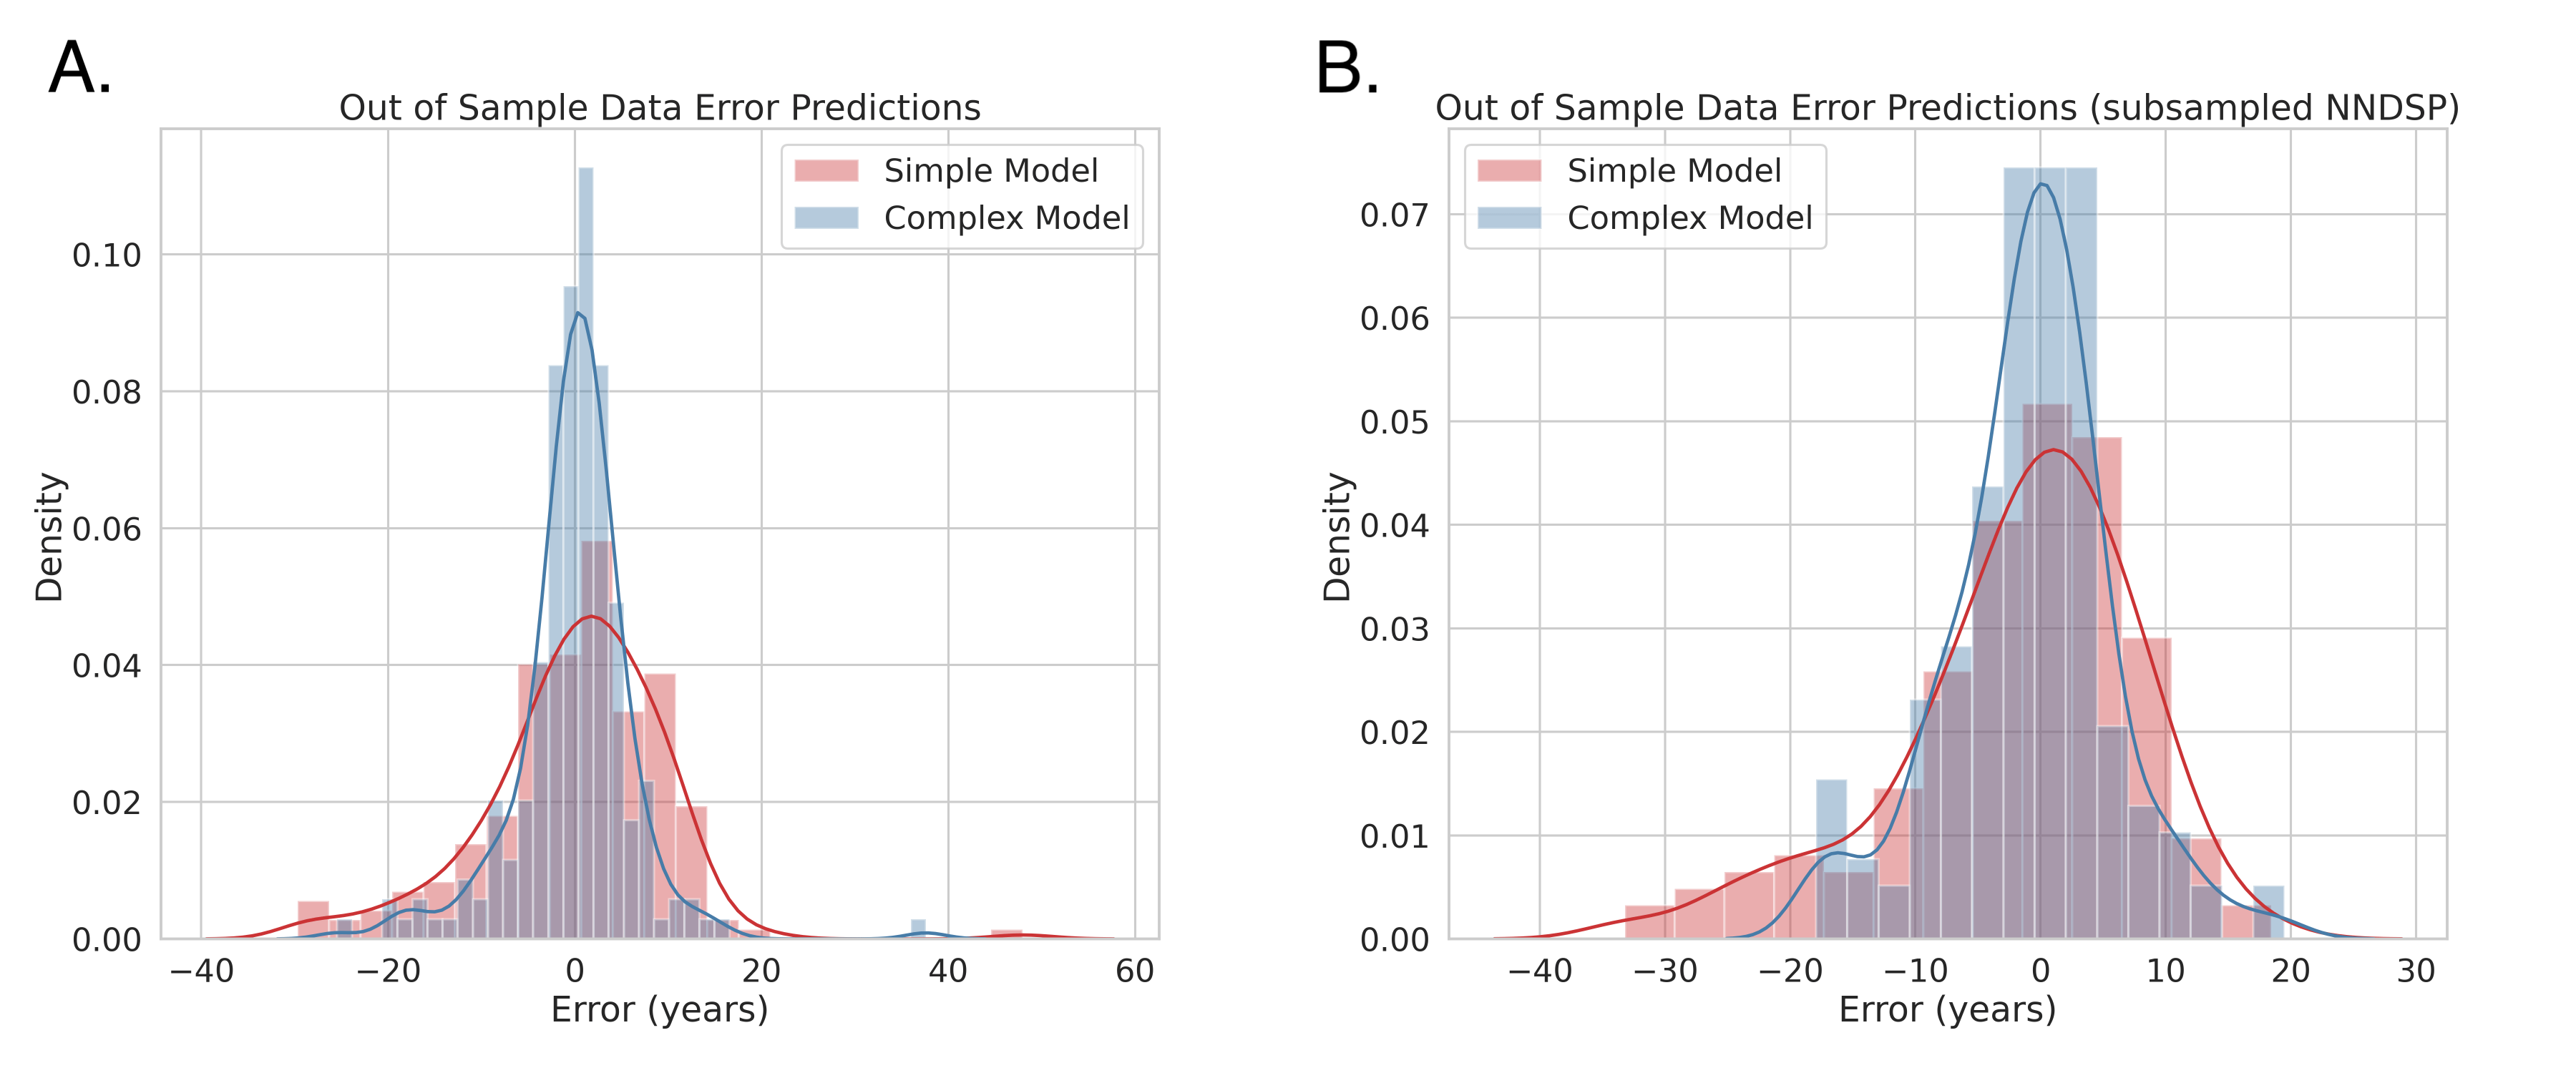
Figure 5. Figure 5A shows the distribution of errors of the simple and complex model trained on the full NNDSP dataset tested on out of sample data. Figure 5B shows the distribution of errors of the simple and complex model trained on subsampled NNDSP tested on out of sample data.

Figure 6. Figure 6A depicts the predicted age as it correlates with the real age of the simple model (R2 = 0.56, CI = (0.47, 0.64)) and the complex model (R2 = 0.81, CI = (0.76, 0.86)) trained on the full NNDSP dataset. Figure 6B depicts the chronological age as it correlates with prediction errors of the simple model (R2 = 0.45, CI = (0.35, 0.54)) and complex model (R2 = 0.18, CI = (0.09, 0.27)) trained on the full NNDSP dataset tested on out of sample data. Figure 6C shows the correlation between error predictions of the simple model and the complex model (R2 = 0.37, CI = (0.27, 0.47)) trained on the full NNDSP dataset.
Citation
Liem, F., Varoquaux, G., Kynast, J., Beyer, F., Masouleh, S. K., Huntenburg, J. M., Lampe,542L., Rahim, M., Abraham, A., Craddock, R. C., Riedel-Heller, S., Luck, T., Loeffler, M., Schroeter, M. L., Witte, A. V., Villringer, A., and Margulies, D. S. (2017). Predicting brain-544age from multimodal imaging data captures cognitive impairment.NeuroImage, 148:179 –545188, ISSN:1053-8119, DOI:10.1016/j.neuroimage.2016.11.005,http://www.546sciencedirect.com/science/article/pii/S1053811916306103.
